


1.研究の背景
デジタル画像相関 (DIC) モーダル解析は、DIC 技術を利用して振動中の構造画像を非接触で測定し、固有周波数、減衰比、その他のパラメータを決定して共振を回避し、動的負荷下での構造性能を向上させます。
一般的な DIC モード解析法には、確率的サブスペース識別 (SSI) 法とベイジアン パワー スペクトル法があります。SSI はモード パラメータを正確に識別しますが、計算速度が遅く、時間がかかります。ベイジアン パワー スペクトル法は、励起の不確実性を定量化しますが、過度の計算を必要とするため、実際のエンジニアリング アプリケーションが制限されます。
Revealer研究チームは、 クロスパワースペクトルベースのDICモード解析法簡単なテスト、効率的な計算、正確なモーダルを特徴とする
識別、および正確な振動モード測定。
2.方法の原理
クロスパワースペクトルは、2つの信号間の相関関係を記述するスペクトル解析法である。信号x(t)、y(t)の相互相関関数Pxy(f)を計算し、それを周波数領域に変換してクロスパワースペクトルPを取得し、位相と振幅を解析する。
周波数間の関係。主な原則は次のとおりです。

• Pxy(f): クロスパワースペクトル
• x(t): 時刻の最初の信号
• Y∗(t−τ): 時刻t−τにおける2番目の信号の複素共役
• τ: クロスパワースペクトル計算における信号オフセットの時間遅延
• e−j2πft: 周波数成分を抽出するための周波数領域回転係数
• j: 虚数単位 (−1−1)
• t: 時間変数
• f: 頻度変数
クロスパワースペクトル周波数領域マトリックスは、n 個の信号間の信号間関係を表し、システムの固有周波数とモードマトリックスを抽出します。

3.方法手順
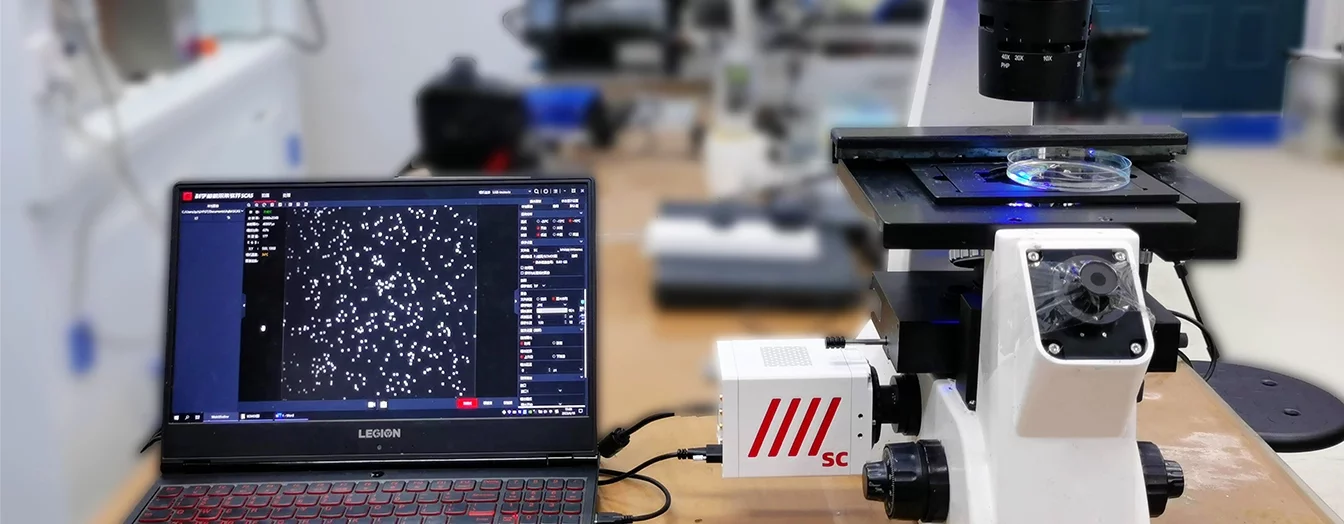
ステップ1: データの取得
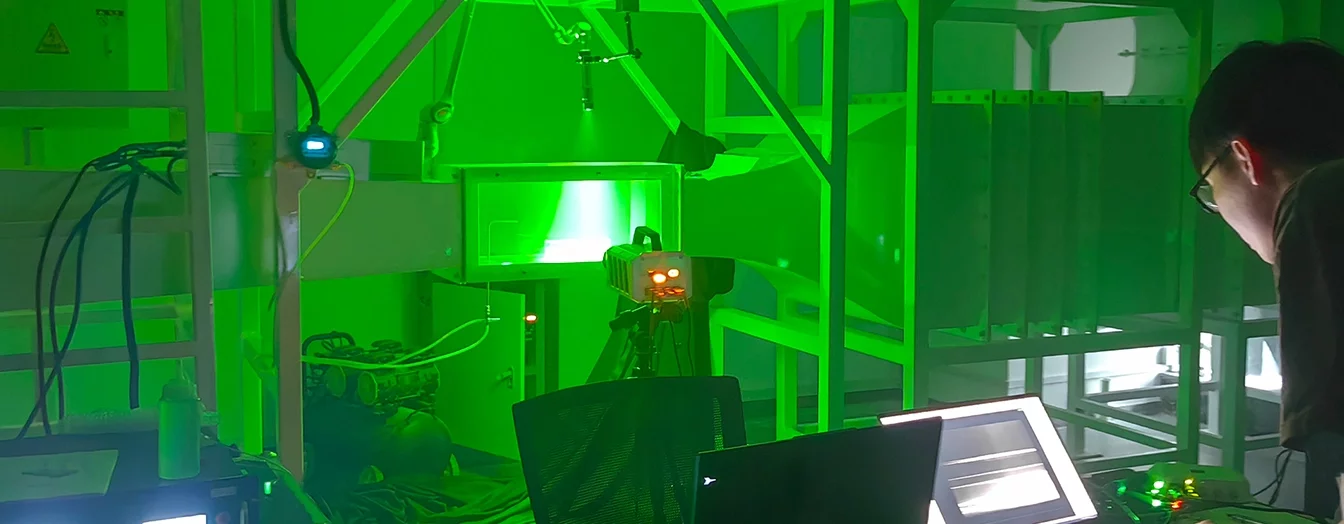
Thousand-Eyes Wolf DIC 測定システムを使用して、さまざまな励起 (衝撃や振動など) を受ける構造コンポーネントの画像をキャプチャし、動的応答を記録します。
ステップ2: 画像処理
画像を処理して、物体の表面の変位場を抽出します。DICアルゴリズムを使用してすべてのポイントの変位時系列データを計算し、振動信号を生成します。
ステップ3: 信号の前処理
変位データのノイズを除去し、ハイパス/ローパス フィルターを適用して無関係な周波数成分を除去します。
ステップ4: フーリエ変換
前処理された信号をフーリエ変換によって周波数領域に変換します。
ステップ5: クロスパワースペクトルの計算
信号ペアのクロスパワースペクトル行列を計算する
4.実験分析
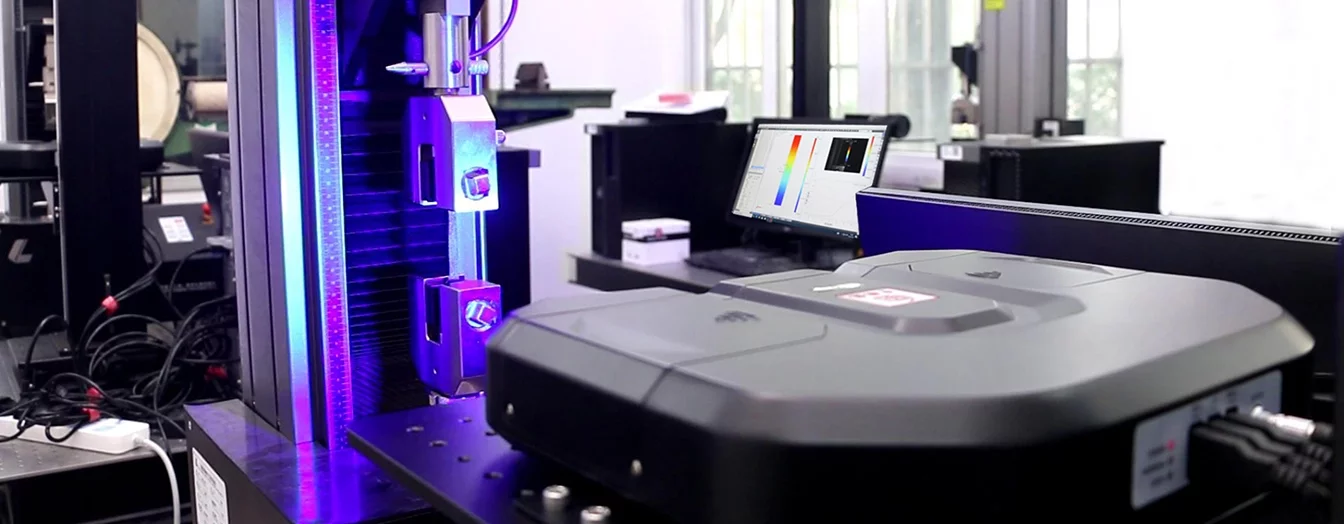
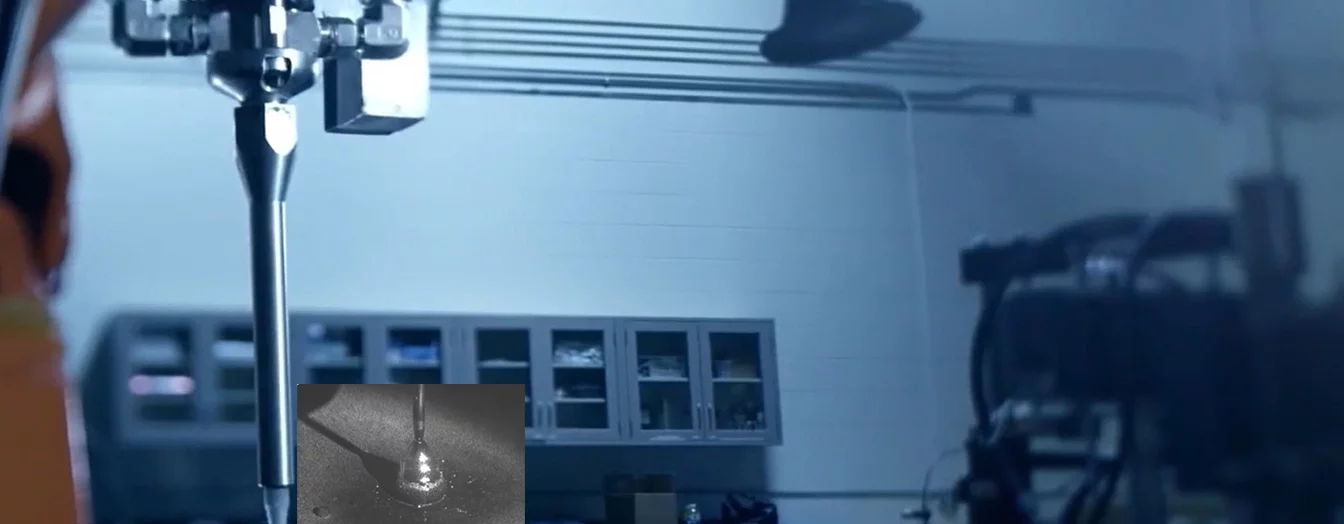
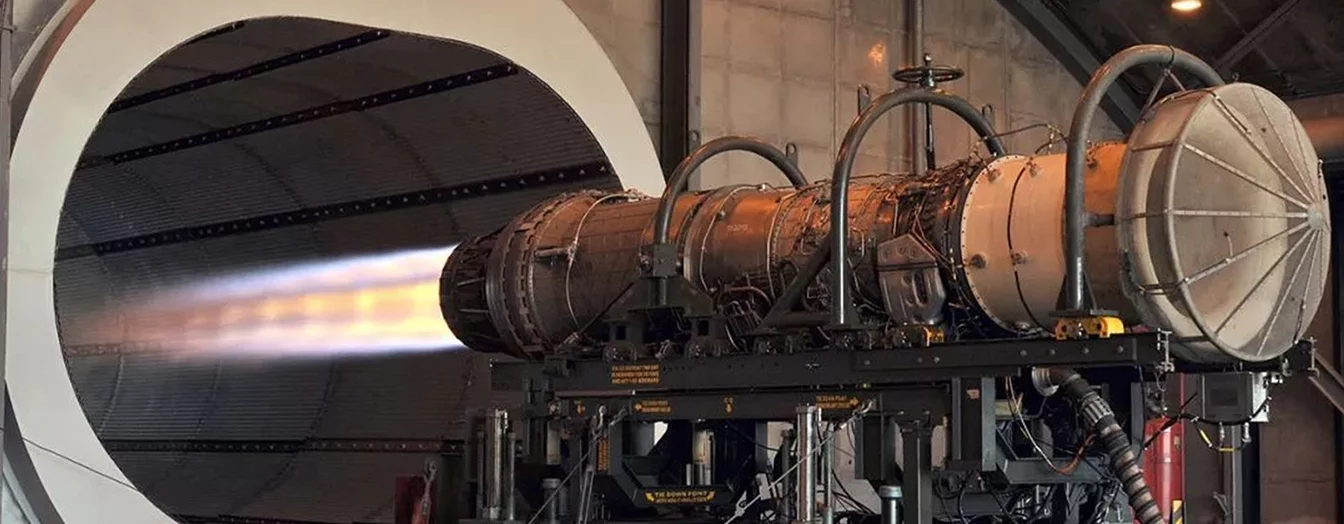
金属板の振動実験を行いました(図1)。ハンマーの衝撃で外部からの加振を模擬し、3D-DIC高速計測システムで振動画像を撮影しました。
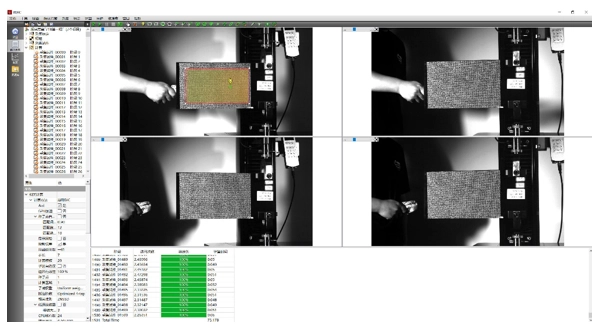
図1: 実験セットアップ
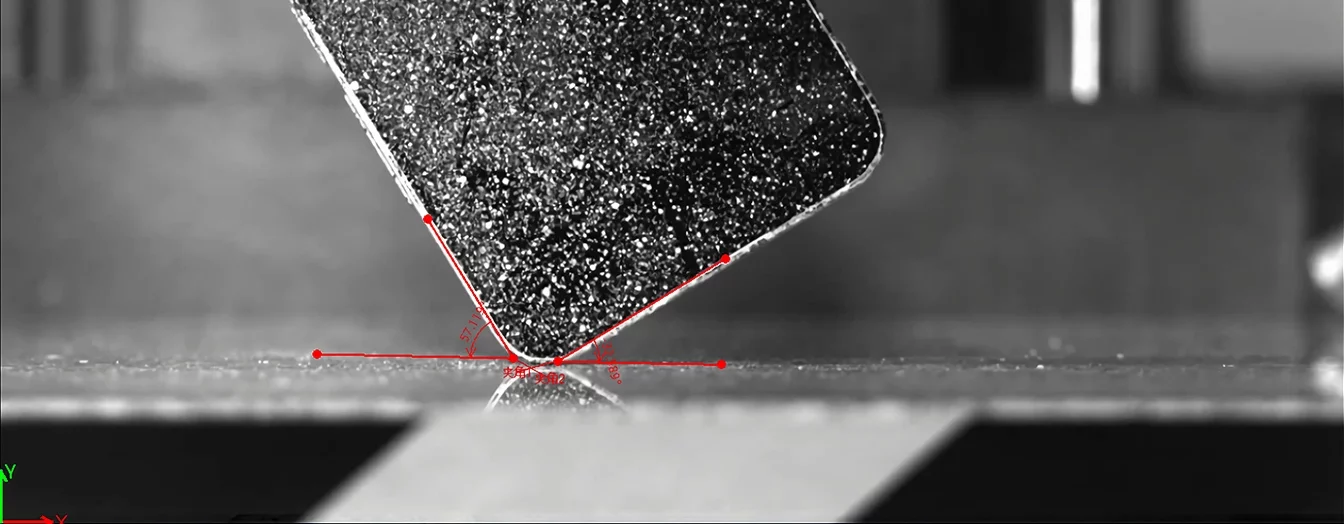
複合変位を観察するために長方形領域が選択されました (図 2)。
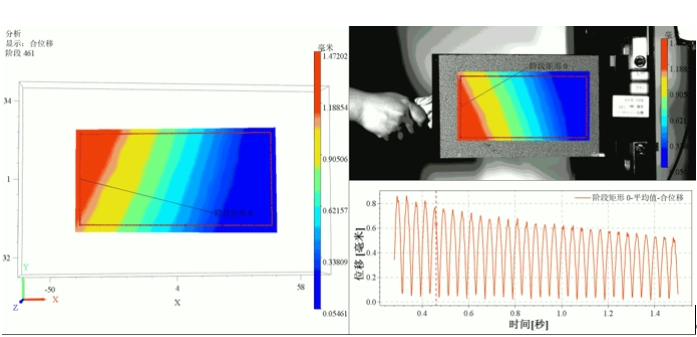
図2: 複合振動変位
Revealer DICモーダル解析モジュールを使用した解析結果を以下に示します。
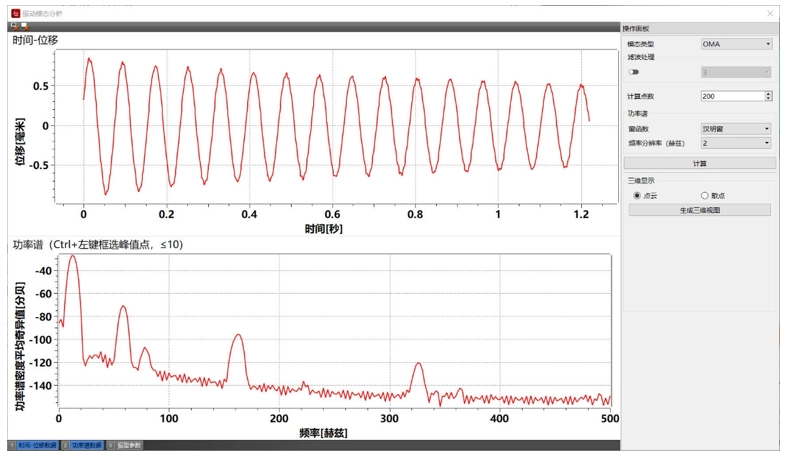
図3: クロスパワースペクトル

図4: 多次振動モード
5.研究概要
この論文では、デジタル画像相関 (DIC) 技術とクロスパワースペクトル解析を統合した、クロスパワースペクトルベースの DIC モード解析法を紹介します。この方法は、高精度の全視野変位測定を提供し、複数の観測点にわたるモードパラメータを識別し、多次構造振動モードを捕捉します。
提案された方法は、橋梁や高層ビルなどの複雑で大規模な構造物の健全性監視と動的解析に大きなエンジニアリング上の利点をもたらします。

